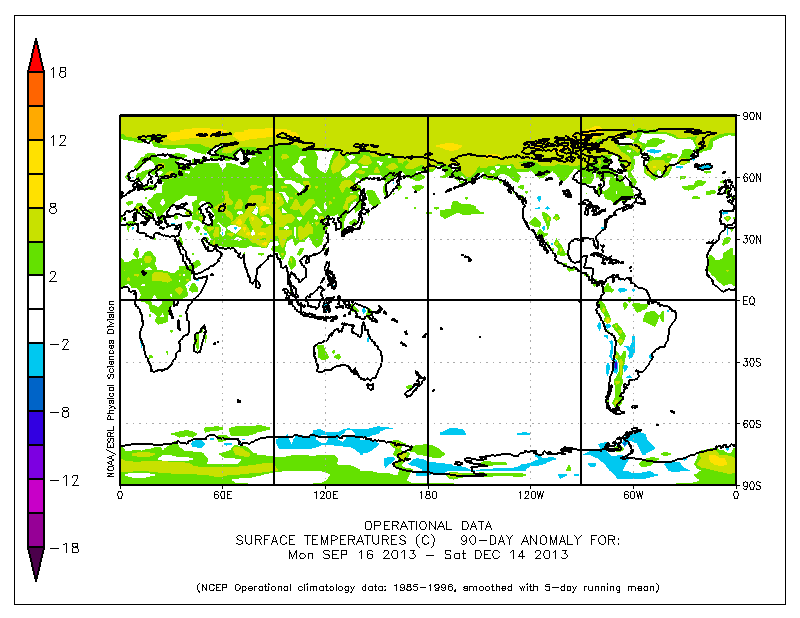
Indeed, global warming is hitting the Arctic particularly hard, and some models have underestimated the pace at which this is occuring. Most heat goes into the oceans, which - due to the Gulf Stream - contributes to accelerated warming in the Arctic, where also less monitoring takes place than over land. Stefan Rahmstorf, Co-Chair of Earth System Analysis at the Potsdam Institute for Climate Impact Research, says at RealClimate:
A new study by British and Canadian researchers shows that the global temperature rise of the past 15 years has been greatly underestimated. The reason is the data gaps in the weather station network, especially in the Arctic. If you fill these data gaps using satellite measurements, the warming trend is more than doubled in the widely used HadCRUT4 data.Where did warming occur most strongly in 2013? The red/orange areas on the image below shows surface temperature anomalies of more than 2°C for the year from December 13, 2012, to December 12, 2012.
As the image shows, temperature anomalies have hit Earth most strongly in the cryosphere, i.e.
- in Antarctica, as discussed at this post;
- on the Qinghai-Tibetan Plateau, as earlier discussed at this post;
- in the Arctic, as discussed below.
Over the past 90 days, the Arctic Ocean has shown surface temperature anomalies of over 5°C and in some spots over 8°C.
Looking at anomalies over longer periods can mask the occurrence of much higher anomalies on individual days. As an example, temperature anomalies of over 20°C were recorded over a large part of the Arctic Ocean on November 17, 2013.
Baffin Bay, west of Greenland, has until now received little attention. High temperature anomalies over the past year show up on the top image. These high temperatures are the more striking given that a cold sea current runs through Baffin Bay, as shown on the image below.
Methane has emerged strongly from areas that have warmed most in 2013. In August 2013, high concentrations of methane showed up over Siberia. High methane releases have further occurred in all three parts of the cryosphere mentioned above, i.e. from the heights of Antarctica, as discussed at this post, on the Qinghai-Tibetan Plateau, as earlier discussed at this post, and in the Arctic, as discussed in many posts at the Arctic-news blog.
Huge methane concentrations have featured over Baffin Bay recently. The animation below shows huge methane emissions emerging from Baffin Bay on December 1-2, 2013. The power behind these methane releases is strong enough to make it difficult for thicker ice to form in Baffin Bay. The animation below shows an area marked by a red rectangle where it looks like the water would have been covered with thicker ice, had there not been so much methane bubbling up in the area.
Huge methane concentrations have featured over Baffin Bay recently. The animation below shows huge methane emissions emerging from Baffin Bay on December 1-2, 2013. The power behind these methane releases is strong enough to make it difficult for thicker ice to form in Baffin Bay. The animation below shows an area marked by a red rectangle where it looks like the water would have been covered with thicker ice, had there not been so much methane bubbling up in the area.
This area with very thin ice in Baffin Bay is further illustrated in the Naval Research Laboratory 30-day Arctic sea ice thickness animation below.
This constitues yet another feedback, i.e. methane bubbling up from the seafloor of the Arctic Ocean with a force strong enough to prevent sea ice from forming in the area.


Yet another positive feedback: methane bubbles prevent the normal ice cover from forming. I once counted over a dozen such positive feedback mechanisms, related to methane hydrate and permafrost gas release. Perhaps some articles in that vein would help to alert the world. Great work!
ReplyDeleteThanks. Yes, feedbacks can rapidly accelerate warming in the Arctic, due to their accumulation, interactions and non-linear impact, as also described at Abrupt Global Warming.
DeleteSam,
ReplyDeleteI just wanted to say thanks for the work you are doing here. I recently went down the rabbit hole after watching a weeks worth of Guy McPhersons video presentations. I gather anyone who stumbles across this information for the first time has that A-HA moment where everything else seems quite meaningless.
I will be spending more time reading your new posts, data and information.
steve
Funny thing. If you look through the animation of Ice Thickness around greenland, you get the impression, that methane is not only bubbling up on the west side of greenland, but also as if methane is pushed southwards from under the thick ice sheet, through the see passage northwestside of greenland, into the baffin bay - under high pressure!
ReplyDeleteThere seem to be signs of the enourmous physical force which is put into fast forward mode!
Yes, Felix, I also discussed this in a recent post. At first glance, the persistently high methane readings over large parts of Baffin Bay may look like they are the result of hydrate destabilization on the seafloor of Baffin Bay. However, water currents in Baffin Bay are typically cold, making it more likely that the methane originated from areas along the fault line that crosses the Arctic Ocean and that the methane traveled - underneath the sea ice along currents - all the way to the edges of the sea ice where the ice is sufficiently fractured and thin to allow methane to rise to the surface.
DeleteI think some one needs to do a documentary about whats going on in the arctic region and show it in every cinema in the world , seeing is believing and this would be the best way to get the message out there. Does anyone know any wealthy oil tycoons who could help!
ReplyDelete