Friday, September 23, 2016

The Threat Of Arctic Albedo Change

Arctic sea ice extent in 2016 was the lowest since satellite measurements started, when extent is averaged over the period from March 20 to September 22, as illustrated by the image below.


As the added trend also illustrates, this decline in Arctic sea ice extent looks set to further accelerate and result in a dramatic fall in albedo. The trend points at zero sea ice over this entire period in less than two decades from now.

Zero sea ice on a single day looks set to occur much earlier; a similar trend points at minimum sea ice extent reaching zero in about a decade from now, as illustrated by the image below.

Above image also shows average sea ice extent data for the period January 1 to September 22, i.e. the year to date (blue line). The added trend points at zero being reached in 2037. The data show that Arctic sea ice extent also was the lowest since satellite measurements started, when extent is averaged over the period from January 1 to September 22.

Finally, the image also shows data for the average sea ice extent over the entire year. Data for 2016 are not available yet, but it does look like 2016 will also be have the lowest sea ice extent when averaged over the entire year.

Anyway, the period between the equinoxes of March 20 and September 22/23 is most important, as the Arctic receives most sunlight during this period. This is illustrated by the image on the right and by he image below, from an earlier post, which further shows that the amount of solar radiation received by the Arctic at the time of the June Solstice is higher than anywhere else on Earth.


Thick sea ice covered with snow can reflect as much as 90% of the incoming solar radiation. After the snow begins to melt, and because shallow melt ponds have an albedo (or reflectivity) of approximately 0.2 to 0.4, the surface albedo drops to about 0.75. As melt ponds grow and deepen, the surface albedo can drop to 0.15, while the ocean reflects only 6% of the incoming solar radiation and absorbs the rest.


As Professor Peter Wadhams, University of Cambridge, once calculated, a collapse of the sea ice would go hand in hand with dramatic loss of snow and ice cover on land in the Arctic. The albedo change resulting from the snowline retreat on land is similarly large as the retreat of sea ice, so the combined impact could be well over 2 W/sq m. To put this in context, albedo changes in the Arctic alone could more than double the net radiative forcing resulting from the emissions caused by all people of the world, estimated by the IPCC to be 1.6 W/sq m in 2007 and 2.29 W/sq m in 2013.

Professor Peter Wadhams on albedo changes in the Arctic
Collapse of the sea ice could occur even faster than decline of sea ice extent may indicate.

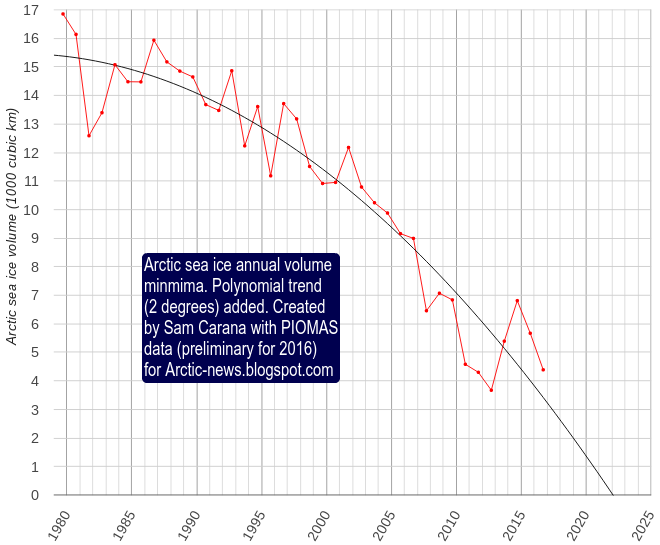
Rapid loss of sea ice thickness has taken place over the years, as discussed in a recent post. A trend based on PIOMAS volume data (preliminary for 2016) points at a collapse around December 2021/January 2022, as illustrated by the graph below.

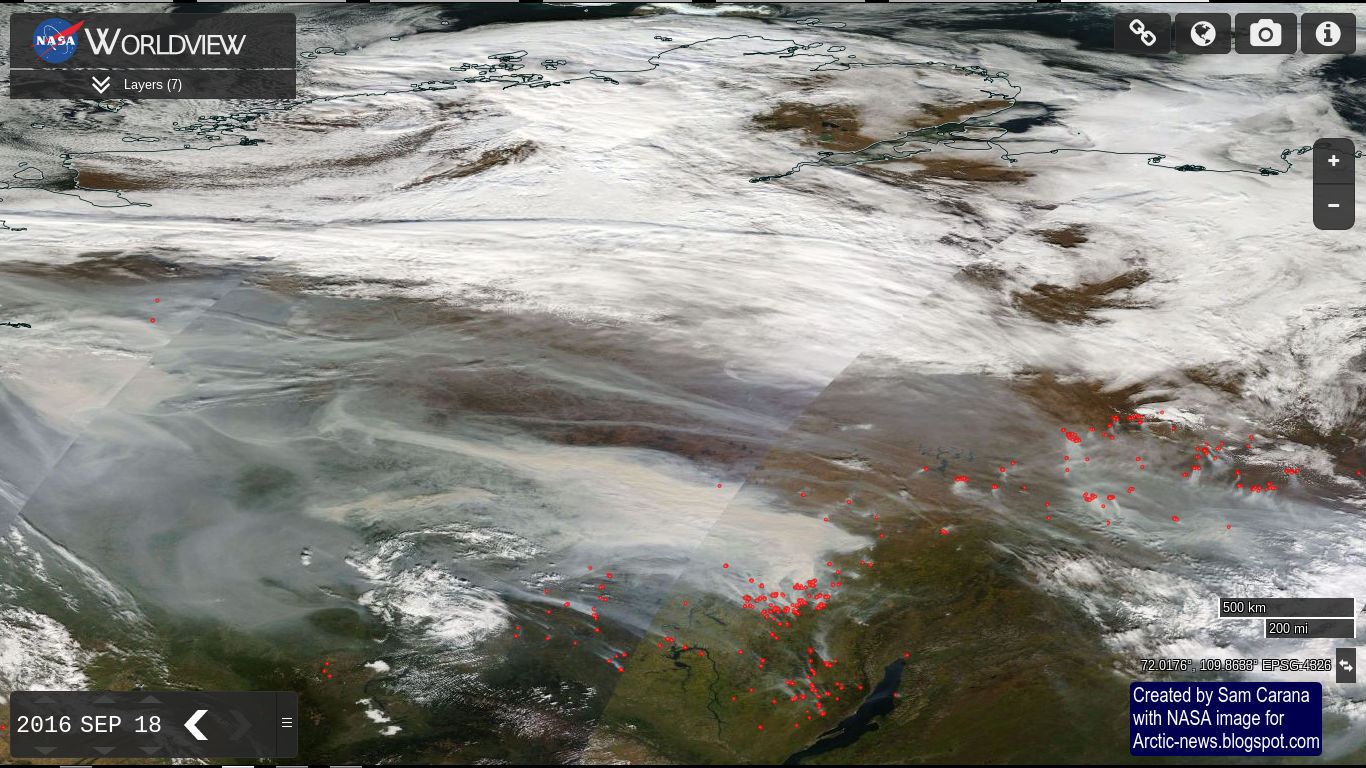
Indeed, Professor Peter Wadhams warned about this in 2012: "global warming will increase the intensity of extreme weather events, so more heavy winds and more intense storms can be expected to increasingly break up the remaining ice, both mechanically and by enhancing ocean heat transfer to the under-ice surface."

Thin sea ice is more vulnerable to the stronger storms that can be expected to hit the Arctic Ocean during the northern summer more frequently, and they could push huge amounts of ice out of the Arctic Ocean.


The sea ice acts as a heat buffer by absorbing energy in the process of melting. In other words, as long as there is sea ice, it will absorb heat and this will prevent this heat from raising the temperature of the water in the Arctic. Once the sea ice is gone, this latent heat must go elsewhere.

As the sea ice heats up, 2.06 J/g of heat goes into every degree Celsius that the temperature of the ice rises. While the ice is melting, all energy (at 334J/g) goes into changing ice into water and the temperature remains at 0°C (273.15K, 32°F).

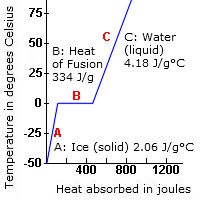
Once all ice has turned into water, all subsequent heat goes into heating up the water, at 4.18 J/g for every degree Celsius that the temperature of water rises.

The amount of energy absorbed by melting ice is as much as it takes to heat an equivalent mass of water from zero to 80°C. The energy required to melt a volume of ice can raise the temperature of the same volume of rock by 150º C.
This buffer is now largely gone and further decline of Arctic sea ice means that a lot more heat will be absorbed by the Arctic.

As the water of the Arctic Ocean keeps warming, the risk increases that methane hydrates at the bottom of the Arctic Ocean will destabilize. Increases in temperature due to albedo changes and methane releases in the Arctic will go hand in hand with further feedbacks, in particular increased levels of water vapor in the atmosphere.

Here's the danger: As decline of the snow and ice cover in the Arctic continues and as more methane gets released from the seafloor, temperatures will rise rapidly, triggering further feedbacks such as a rise of water vapor in the atmosphere. Keep in mind that what makes heat unbearable is a combination of high temperatures with high humidity levels. Furthermore, water vapor is a potent greenhouse gas that will further accelerate the temperature rise. Taken together, we are facing the possibility of a 10°C temperature rise within one decade.

The image below, from the extinction page, shows that we may well be on a trend that is rising even faster than the rapid temperature increases in 2016 may indicate. Indeed, a large part of global warming is currently masked by aerosols and, as we make progress with the necessary shift to clean energy, the full wrath of global warming looks set to become manifest soon.


Risk is the product of probability and severity. The risk of a 10°C temperature rise is incalculably high. On the severity dimension, the impact of such a temperature rise is beyond catastrophic, i.e. we're talking about extinction of species at massive scale, including humans. On the probability dimension, this outcome appears to be inevitable if no comprehensive and effective action is taken.


Above danger assessment adds a third dimension, i.e. timescale. A 10°C temperature rise could eventuate within one decade and this also makes the danger imminent, adding further weight to the need to start taking comprehensive and effective action, as described in the Climate Plan.


Saturday, September 17, 2016

Arctic Sea Ice September 2016 - Update

[ click on images to enlarge ]
On September 10, 2016, Arctic sea ice reached the second lowest extent measured by satellites since 1979, as the image on the right shows. Arctic sea ice took over second-lowest position with an extent of 4.137 million square km. This was 17,000 square km lower than the 2007 minimum, which was 4.154 million square km on September 18, 2007, according to NSIDC data.

Also note the purple line for 2010 on this image. In early September 2010, some people thought a low was reached (on September 12, 2010), but then a much lower extent was reached later (on September 21, 2010).

As the image below shows (screenshot from the Japan Aerospace Exploration Agency), 2016 Arctic sea ice extent (red line) has declined over the past two days.


Arctic sea ice extent may well decline further over the coming days. The image on the right shows a temperature anomaly forecast for September 24, 2016. This gives an idea of the temperature anomalies that can be expected over the Arctic Ocean over the upcoming week. Temperature anomalies over the Arctic as a whole will be above 2 degrees Celsius for almost that entire period.

There is scope for further sea ice decline, for a number of reasons [hat tip to Albert Kallio]:
- high air temperatures over the Arctic Ocean
- warm river water runoff
- high temperatures of the water in the Arctic Ocean
- very thin and fractured sea ice
- increased wave action of the ocean on sea ice
- increased vertical overturning of ocean water
- increased sea ice migration to absorb more heat from water
- increased sea ice transportation to the Atlantic Ocean / melt areas
- decreased snowline and albedo leading to higher insolation
- high and rising levels of greenhouse gases (CO2, CH4, N2O and water vapor) over the Arctic, trapping more heat

The video below shows that high temperatures are forecast over the Arctic Ocean over the upcoming week.


The time-lapse video below is based on NSIDC data and shows the age of sea ice in the Arctic from week to week since 1990, updated through the March 2016 winter maximum. The oldest ice (9 or more years old) is white. Seasonal ice is darkest blue. Old ice drifts out of the Arctic through the Fram Strait (east of Greenland), but in recent years, it has also been melting as it drifts into the southernmost waters of the Beaufort Sea (north of western Canada and Alaska).


The Naval Research Lab animation below show Arctic sea ice thickness over 30 days (up to September 16, 2016, with a forecast added up to September 23, 2016).


The Naval Research Lab sea ice speed and drift animation below over the same period shows that the amount of sea ice that is expected to move into Fram Strait is expected to increase over the next few days.


The image below shows that on September 24, 2016, it was as warm as 5.1°C or 41.1°F at a location where there still is some of the thicker Arctic sea ice left, with the inset showing Arctic sea ice on September 22, 2016.


The image below shows areas with some of the thicker sea ice on September 18, 2016.


The image below shows that sea surface temperatures on September 18, 2016, were much higher than they were in 1981-2000, especially at higher latitudes.


The image below shows September 18, 2016 sea surface temperature anomalies in the Arctic (latitudes 60°N - 90°N) compared to 1961-1990.


The danger is that, as temperatures of the water of the Arctic Ocean keep rising, heat will reach sediments at the bottom of the Arctic Ocean containing methane hydrates that are on the verge of destabilization. A small increase in temperatures could trigger huge abrupt release of methane from the seafloor of the Arctic Ocean.

The image below shows that on September 14, 2016, methane levels at 367 mb were as high as 2697 ppb and global mean methane level was as high as 1865 ppb.

The image below shows wildfires in Russia on September 18, 2016.


The image below shows that on September 18, 2016, these wildfires resulted in carbon monoxide levels as high as 24,309 ppb (top), and carbon dioxide levels as high as 612 ppm (bottom).


The image below shows that, on September 19, 2016, carbon monoxide levels were as high as 38,035 ppb (green circle left) and carbon dioxide levels were as high as 701 ppm (green circle right).


The situation is dire and calls for comprehensive and effective action, as described in the Climate Plan.


Links

 Arctic Sea Ice September 2016
http://arctic-news.blogspot.com/2016/09/arctic-sea-ice-september-2016.html

 Storms over Arctic Ocean
http://arctic-news.blogspot.com/2016/08/storms-over-arctic-ocean.html

 Wildfires in Russia's Far East
http://arctic-news.blogspot.com/2016/08/wildfires-in-russias-far-east.html

 Arctic Sea Ice Getting Terribly Thin
http://arctic-news.blogspot.com/2016/08/arctic-sea-ice-getting-terribly-thin.html

 High Methane Levels Follow Earthquake in Arctic Ocean
http://arctic-news.blogspot.com/2016/07/high-methane-levels-follow-earthquake-in-arctic-ocean.html


Tuesday, September 13, 2016

August 2016 another month above Paris Agreement guardrail

[ click on images to enlarge ]
August 2016 was the warmest August in 136 years of modern record-keeping, according to a NASA news release and as illustrated by the image on the right.

The seasonal cycle makes that temperature typically peaks in July. Nonetheless, August 2016 wound up tied with July 2016 for the warmest month ever recorded.

So, when incorporating the seasonal cycle, it was more than 2°C or 3.6°F warmer in July and August 2016 than it used to be.

It's important to compare the temperature rise with preindustrial levels, given that end last year at the Paris Agreement countries pledged to keep temperatures from rising by more than 1.5°C above preindustrial levels. NASA typically calculates anomalies by comparing temperatures with the period from 1951 to 1980, so without adjustment and without including seasonal cycle, the picture looks like the one below.


The added polynomial trendline shows that the anomaly grows, when comparing the temperature rise with an period that goes back further. On the image below, a 0.28°C adjustment is applied to the data, to bring the baseline back to the year 1900.


Going back further than 1900 will result in even higher anomalies, as illustrated by the image below that applies a 0.58°C adjustment to cater for the rise before 1951-1980, as discussed in an earlier post, resulting in an August 2016 anomaly of 1.56°C.

As above image also shows, temperatures have been more than 1.5°C above preindustrial levels for most of the past 12 months.

The situation is dire and calls for comprehensive and effective action as described in the Climate Plan.

Links

 Climate Plan
http://arctic-news.blogspot.com/p/climateplan.html

 How Much Warming Have Humans Caused?
http://arctic-news.blogspot.com/2016/05/how-much-warming-have-humans-caused.html

 NASA Analysis Finds August 2016 Another Record Month
http://data.giss.nasa.gov/gistemp/news/20160912


Thursday, September 8, 2016

Arctic Sea Ice September 2016

On September 8, 2016, there was hardly any sea ice left around the North Pole, as illustrated by the image below.


The image below, made with a screenshot from ads.nipr.ac.jp, shows that, on September 7, 2016, Arctic sea ice extent (i.e. areas with 15% ice or more) was 4.02 million square km. While this is above the minimum extent of 2012, it is less than what the minimum extent was for all other years on the image.


The image below shows extent as calculated by NSIDC.org, which is only slightly different from the above image.


Even more frightening than sea ice extent is sea ice thickness, as illustrated by the image on the right, showing a nowcast (in m), run on September 7, 2016, and valid for September 8, 2016.

The image shows that the multi-year sea ice has now virtually disappeared and that there's virtually no buffer left to absorb ocean heat.

The image below shows sea ice thickness for the years 2012 through 2016, each time a nowcast, run on September 7 and valid for September 8 of the respective year. Note the fall in sea ice thicker than 1.5 m (light-blue, yellow and red) over the years.

[click on image to enlarge ]
The image below shows the northern tip of Greenland, where some of the thickest sea ice is present, or rather what's left of it.


[ click on images to enlarge ]
As above image shows, this thicker sea ice has become fractured into pieces. The pieces are getting pushed to the right, out of the Arctic Ocean, through Fram Strait into the Atlantic Ocean.

This is further illustrated by the animation on the right that shows this fracturing of the thicker sea ice taking place from September 4, 2016, through to September 9, 2016.

This process of fracturing and movement of the sea ice could speed up significantly due to strong winds, as illustrated by the image on the right.

These strong anticlockwise-moving cyclonic winds are forecast to move north through Fram Strait, accelerating the speed at which water flows through Fram Strait, as illustrated by the video below.

Further below are Naval Research Lab animations that show the shrinking of sea ice thickness (left) and compressive strength (right) in the Beaufort Sea up to September 5, 2016, with a forecast up to September 11, 2016.


Click on images to enlarge
 
Coasts of Alaska is at the bottom, of Canada on the right
Ocean heat is a big contributor to Arctic sea ice demise. The image below, from an earlier post, shows a terrifying trend in warming of the sea surface on the Northern Hemisphere. Next to the albedo changes that come with the demise of the Arctic snow and ice cover, there is an increasing danger that heat will reach the seafloor and will destabilize methane hydrates contained in sediments at the seafloor of the Arctic Ocean.


The image below shows Arctic sea surface temperature anomalies on September 4, 2016.


Meanwhile, the methane situation looks very threatening. The image below gives an update on the high levels recently recorded at Barrow, Alaska.
The situation is dire and calls for comprehensive and effective action as described at the Climate Plan.