Saturday, October 11, 2014

Climate Change Accelerating

Methane levels as high as 2562 ppb were recorded on October 9, 2014, as illustrated by the image below.

Many grey areas show up in the image where QC (quality control) failed, as it was too hard to read methane levels in the respective area, apparently due to high moisture levels (i.e. snow, rain or water vapor) in the atmosphere.


As above image illustrates, cloud cover is high over the Arctic, while there is also precipatation in the form of snowfall.

In other words, high levels of methane (above 1950 ppb, colored yellow) could be present over a much larger part of the Arctic Ocean, while methane in these grey areas could be even higher than the measured peak level of 2456 ppb.

This appears to be confirmed by persistent high methane levels over vast areas across the Arctic Ocean both in the morning (top part of the image further above) and in the afternoon (bottom part of image) on 9 October 2014.

Methane levels are this high over the Arctic Ocean for the number of reasons, including:
  • The Gulf Stream keeps pushing warm water into the Arctic Ocean.
  • The resulting eruptions of methane from the seafloor of the Arctic Ocean constitute a feedback that accelerates warming in the Arctic. 
  • As the Arctic warms up more rapidly than the rest of Earth, the Arctic's ice and snow cover will decline, further accelerating warming in the Arctic.
  • As the Arctic warms up more rapidly than the rest of Earth, the speed at which jet streams circumnavigates the Northern Hemisphere will weaken, making it meander more, resulting in a greater frequency and intensity of extreme weather events, such as heat waves, droughts and wildfires. 
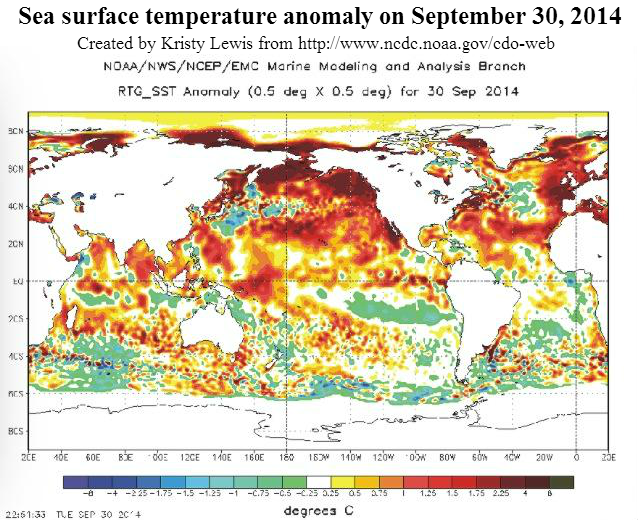
Here's an example of intense warming. Look at what is currently happening on Greenland.

As the image above right shows, sea surface temperature anomalies as high as +1.89°C hit the North Atlantic (on October 8, 2014). 

Furthermore, high cloud cover over the Arctic (image further above) makes it hard for the heat there to radiate out into space, further contributing to high temperature anomalies.

The image on the right shows high temperature anomalies over Greenland and parts of the Arctic Ocean on October 11, 2014. Note that anomalies are averaged out over the course of the day (and night).

The image below (right) shows anomalies at the top end of the scale hitting large parts of Greenland at a specific time during this day. The left part of the image below shows how this could happen, i.e. jet streams curling around Greenland trapping warm air inflow from the North Atlantic.


As said, as the Arctic warms up more rapidly than the rest of Earth, the speed at which jet streams circumnavigate the Northern Hemisphere will weaken, making the jets meander more and creating patterns that can trap heat (or cold) for a number of days over a given area. Due to the height of its mountains, Greenland is particularly prone to be increasingly hit by heatwaves resulting from such blocking patterns. Warming changes the texture of snow and ice, making it more slushy and darker, which also makes that it absorbs more of the sunlight's heat, further accelerating melting.

As Paul Beckwith warns in an earlier post, melt rates on Greenland have doubled in the last 4 to 5 years, and melt rates on the Antarctica Peninsula have increased even faster. Based on the last several decades, melt rates have had a doubling period of around 7 years or so. If this trend continues, we can expect a sea level rise approaching 7 meters by 2070.

From: More than 2.5 m sea level rise by 2040
These are all indications that the pace of climate change is accelerating in many ways, the most dangerous one being ever larger methane eruptions from the Arctic Ocean's seafloor. As the image below shows, sea surface temperature anomalies are very high in the Arctic Ocean, indicating very high temperatures under the surface.


U.S. Secretary of State John Kerry recently said: “There are now – right now – serious food shortages taking place in places like Central America because regions are battling the worst droughts in decades, not 100-year events in terms of floods, in terms of fires, in terms of droughts – 500-year events, something unheard of in our measurement of weather.” Warning about looming catastrophe, Kerry adds: “Life as you know it on Earth ends. Seven degrees increase Fahrenheit (3.9°C), and we can't sustain crops, water, life under those circumstances.”

The situation is dire and calls for comprehensive and effective action, as discussed at the Climate Plan blog.


Monday, October 6, 2014

Wild Weather Swings


Above combination-image illustrates some of the wild temperature swings that are taking place on the Northern Hemisphere. While the average temperature anomaly on the Northern Hemisphere may not differ much between the two dates (+0.95°C versus +1.07°C), huge temperature swings can occur locally, as is the case in Greenland.

Note that the overall temperature anomaly for the Arctic is +2.16°C and +3.34°C, respectively, but it can be much more locally. What contributes to these high temperatures in the Arctic is that heat from the Arctic Ocean is entering the atmosphere where there still is open water, while large emissions of methane from the seafloor of the Arctic Ocean are exercizing their high immediate local warming potential.

On the Southern Hemisphere, things aren't much different, as illustrated by the combination-image below.


The two images show that, while the average anomaly for the Southern Hemisphere and for the Antarctic may not differ much between the two dates, temperature anomalies locally may go from one end of the scale to the other.

And it's not merely temperatures that seem to have gone wild. Winds have strengthened, which can push sea ice far out into the sea surrounding Antarctica, while the resulting open water quickly freezes over. The result is expanding sea ice that traps heat in the ocean, as discussed in an earlier post. It appears that much of the extra energy trapped by greenhouse gasses becomes manifest as kinetic energy, in the form of stronger winds, storms and ocean currents.

In conclusion, these huge temperature swings combine with pressure swings and storms, and with swings between expansion and contraction of soil and ice, resulting in severe shocks to ecosystems and infrastructure.

The threat is that infrastructure will increasingly come under stress. Infrastructure that was built up over hundreds, if not thousands of years, is not easily replaced with more durable alternatives. Parts of infrastructure such as roads, buildings, railways, storm water and drainage systems, water supply, dams, levees and power poles may collapse without much scope for repair.

Furthermore, soil degradation will increase, as in some areas storms grow stronger and run-off causes more erosion, while other areas may be hit by more severe droughts and dust-storms. In both cases, ecosystems will suffer and can go into shock, bringing food supply and habitat progressively and possibly abruptly under threat.

As more and deeper cracks and fractures appear in sediments and soils, more methane may start entering the atmosphere. Indications that the integrity of the permafrost is breaking up under the stress of such swings were discussed in earlier posts such as this one and this one. The extra methane can constitute a powerful additional feedback loop, causing strong additional warming locally.

The situation is dire and calls for comprehensive and effective action, as discussed at the Climate Plan blog.


References and Related Posts


- Climate Plan
http://arctic-news.blogspot.com/2014/07/climate-plan.html

- Antarctica linked to Arctic
http://arctic-news.blogspot.com/2014/09/antarctica-linked-to-arctic.html

- What's wrong with the weather?
http://arctic-news.blogspot.com/2014/07/whats-wrong-with-the-weather.html

- Is Global Warming breaking up the Integrity of the Permafrost?
http://methane-hydrates.blogspot.com/2013/05/is-global-warming-breaking-up-the-integrity-of-the-permafrost.html

- Earthquakes in the Arctic Ocean
http://arctic-news.blogspot.com/2014/04/earthquakes-in-the-arctic-ocean.html

- Ten Dangers of Global Warming (written March, 2007)
http://samcarana.blogspot.com/2007/03/ten-dangers-of-global-warming.html


Saturday, October 4, 2014

Record June–August Global Ocean Surface Temperature

August 2014 record high land and ocean temperature

The combined average temperature across global land and ocean surfaces for August 2014 was record high for the month, at 0.75°C (1.35°F) above the 20th century average of 15.6°C (60.1°F).

June–August 2014 record high land and ocean temperature

June–August 2014, at 0.71°C (1.28°F) higher than the 20th century average, was the warmest such period across global land and ocean surfaces since record keeping began in 1880.

August 2014 record high sea surface temperature

The August global sea surface temperature (SST) was 0.65°C (1.17°F) above the 20th century average of 16.4°C (61.4°F). This record high departure from average not only beats the previous August record set in 2005 by 0.08°C (0.14°F), but also beats the previous all-time record set just two months ago in June 2014 by 0.03°C (0.05°F).

June–August 2014 record high sea surface temperature

The June–August global ocean surface temperature was 0.63°C (1.13°F) above the 20th century average, the highest on record for June–August. This beats the previous record set in 2009 by 0.04°C (0.07°F).


John Davies comments: 

This was the warmest August on record, primarily due to very high Sea Surface Temperatures in the Northern Hemisphere.

There is no El Nino event in this period, but some sort of event - hopefully an event not a climate shift - is taking place. If this is an event, the situation will become more normal when it ends, which will be in less than a years time at worst. If it is a climate shift, we are in desperate trouble, though I think it is an event.

It is worth noting that these very high Sea Surface Temperatures are likely to lead to high land temperatures soon, as normally land temperatures in the Northern hemisphere can be expected to exceed Sea Surface Temperatures.

The drought affecting California and the whole of the west of North America, Central America, and large parts of the Brazilian rainforest, though preceding this event was almost certainly down to changes which started before this event but ultimately caused it.


Despite the record high combined average temperature across global land and ocean surfaces for August, the global economy will continue as normal and no specific action can be expected to be taken to curb emissions. This will change, if global temperatures continue to rise. Temperatures are high enough to cause global concern, however. More later.


Note: NOAA's most recent (Sep 4, 2014) prediction puts the chance of El Niño at 60-65% during the Northern Hemisphere fall and winter.


Sea surface temperatures (SST) can be expected to remain high in the Arctic Ocean, as SST anomalies are high in the North Atlantic (+1.65°C, image left) and high temperatures are forecast over the Arctic for at least the next seven days (anomalies as high as +2.87°C, image right). For a comparison with October 3 temperatures, see this earlier post.

Additionally, an increasing amount of heat has been going into the deeper parts of the ocean, and the Gulf Stream will for month to come continue to transport water into the Arctic Ocean, and this water will be warmer than the water already there, threatening to unleash ever larger eruptions of methane from the seafloor of the Arctic Ocean, as discussed in this earlier post.

In conclusion, the situation is dire and calls for comprehensive and effective action, as discussed at the Climate Plan blog.


References

- NOAA National Climatic Data Center, State of the Climate: Global Analysis for August 2014.
http://www.ncdc.noaa.gov/sotc/global/2014/8

- EL NIÑO/SOUTHERN OSCILLATION (ENSO) DIAGNOSTIC DISCUSSION, issued by:
Climate Prediction Center/NCEP/NWS and the International Research Institute for Climate and Society, 4 September 2014
http://www.cpc.ncep.noaa.gov/products/analysis_monitoring/enso_advisory/ensodisc.pdf

- ENSO: Recent Evolution, Current Status and Predictions
http://www.cpc.ncep.noaa.gov/products/analysis_monitoring/lanina/enso_evolution-status-fcsts-web.pdf

- ClimateReanalyzer.org
http://climatereanalyzer.org


Friday, October 3, 2014

Where we are - A climate system summary

by Paul Beckwith


Air


The presence of GHGs (greenhouse gases) in the atmosphere is vital to sustain life on our planet. These GHGs trap heat and keep the global average surface temperature of the planet at about 15°C, versus a chilly -18°C, which would be our temperature without the GHGs.

We have changed the chemistry of the atmosphere, specifically of the concentrations of the GHGs. Concentrations of carbon dioxide have increased about 40% since the start of the industrial revolution (from a tight range between 180 to 280 ppm over at least the last million years) to 400 ppm. Concentrations of methane have increased by more than 2.5x since the start of the industrial revolution (from a tight range of 350 to 700 ppb) to over 1800 ppb. The additional heat trapped has warmed our planet by over 0.8°C over the last century, with most of that rise (0.6°C) occurring in the last 3 or 4 decades.

Oceans

Over 90% of the heat trapped on the surface of the planet is increasing the temperature of the ocean water. The increased levels of carbon dioxide in the atmosphere acidify the rainfall, and have increased the acidity of the oceans by about 40% in the last 3 to 4 decades (pH of the open ocean has dropped from 8.2 down to 8.05 on the logarithmic scale). An increased drop to a pH of 7.8 will prevent calcium based shells from forming, and threaten the entire food chain of the ocean. Changes in ocean currents, and vertical temperature profiles are leading to more stratification and less overturning which is required to transport nutrients to the surface for phytoplankton to thrive.

Global sea levels are presently rising at a rate of 3.4 mm per year, compared to a rate of about 2 mm per year a few decades ago. Melt rates on Greenland have doubled in the last 4 to 5 years, and melt rates on the Antarctica Peninsula have increased even faster. Based on the last several decades, melt rates have had a doubling period of around 7 years or so. If this trend continues, we can expect a sea level rise approaching 7 meters by 2070.

From: More than 2.5 m sea level rise by 2040
Land

Higher global average temperatures have increased the amount of water vapor in the atmosphere by about 4% over the last several decades, and around 6% since the start of the industrial revolution. Changes in heat distribution with latitude from uneven heating with latitude has slowed the jet streams and caused them to become wavier and fractured, and has changed the statistics of weather. We now have higher frequencies, intensities, and longer duration extreme weather events and also a change in location of where these events occur.

Feedback loops

The sensitivity of the climate system to increased levels of GHG appears to be much higher than previously expected due to many powerful reinforcing feedbacks.

From: Arctic Warming due to Snow and Ice Demise

Arctic temperature amplification from exponentially declining sea ice and spring snow cover are the strongest feedbacks in our climate system today. The average albedo (reflectivity) of the Arctic region has decreased from 52% to a present day value of 48% over 3 or 4 decades. The increased absorption of energy in the Arctic has increased the temperature at high latitudes at rates up to 6 to 8x the global average temperature change. The reduced temperature difference between the Arctic and equator has reduced the west to east speed of the jet streams causing them to slow and become wavier and more fractured, and directly causing a large change in the statistics of our global weather.

Methane gas emissions have been rapidly rising in the Arctic region from the terrestrial permafrost and the continental shelf marine sediments, most notably on the ESAS (Eastern Siberia Arctic Shelf). The extremely potent ability of methane to warm the planet (global warming potential GWP is >150, 86, and 34 times for methane relative to carbon dioxide on a few year, several decade, and century timescale, respectively) makes increased emissions an extremely dangerous risk to our well-being on the planet.

My overall assessment

Our climate system is presently undergoing preliminary stages of abrupt climate change. If allowed to continue, the planet climate system is quite capable of undergoing an average global temperature increase of 5°C to 6°C over a decade or two. Precedence for changes at such a large rate can be found at numerous times in the paleo-records. From my chair, I conclude that it is vital that we slash greenhouse gas emissions and undergo a crash program of climate engineering to cool the Arctic region and keep the methane in place in the permafrost and ocean sediments.


Paul Beckwith
Paul Beckwith is part-time professor with the laboratory for paleoclimatology and climatology, department of geography, University of Ottawa. Paul teaches climatology/meteorology and does PhD research on 'Abrupt climate change in the past and present'. Paul holds an M.Sc. in laser physics and a B.Eng. in engineering physics and reached the rank of chess master in a previous life. Click here to view Paul's earlier posts at the Arctic-news blog.


Related

- What's wrong with the weather?
http://arctic-news.blogspot.com/2014/07/whats-wrong-with-the-weather.html

- Arctic News: Polar jet stream appears hugely deformed
http://arctic-news.blogspot.com/2012/12/polar-jet-stream-appears-hugely-deformed.html


Tuesday, September 30, 2014

Warm water extends from Laptev Sea to North Pole

The NOAA NESDIS image below shows sea surface temperature anomalies of well over 1ºC extending to the North Pole.


The image below gives a world view, showing SST anomalies at the top end of the scale in the Laptev Sea.


The top end of the scale on the above image is 5ºC (or 9ºF).


The visualizations above and below uses a much higher scale. Even this higher-end scale doesn't appear to fully capture the dire situation we are in.


Above image shows warm water entering the Arctic Ocean through the Bering Strait and from the North Atlantic. For months to come, the Gulf Stream will keep pushing warm water into the Arctic Ocean (i.e. water that is warmer than the water in the Arctic Ocean). It takes some time (i.e. months) for the warm water from the north Atlantic to arrive in the Arctic Ocean.

Last year, methane emissions started to become huge in October and this lasted for some six months. The image below, from an earlier post, shows methane eruptions from the seafloor of the Arctic Ocean on October 16/17, 2013.


The image below, from another earlier post, shows methane eruptions from the seafloor of the Arctic Ocean on October 31, 2013.


The image below, from yet another earlier post, shows methane levels as high as 2662 parts per billion on November 9, 2013.


This year, there is even more ocean heat present, especially in the north Atlantic and the north Pacific. On September 29, 2014, methane levels as high as 2641 parts per billion were recorded and it looks like worse is yet to come.


The video below, Sea floor methane hydrate climate hazard, is an extract produced by Peter Carter from a presentation by Miriam Kastner, uploaded 7 August 2008 at Youtube.


The situation is dire and calls for comprehensive and effective action, as discussed at the Climate Plan blog.


Monday, September 22, 2014

350,000 Marchers = 50 Parts Per Million

People's Climate March, New York, September 21, 2014, photo by Cindy Snodgrass

by Nathan Currier

How big a deal was the march in Manhattan yesterday? One of the organizers was 350.org, a group started by Bill McKibben based on a paper by climate scientist James Hansen which stated that we should aim for about 350 parts per million (ppm) CO2. We are currently at about 400ppm, so we need to move "only" about 50ppm in the opposite direction from our rapid growth, which hit a frightening 3ppm clip last year.

It will take a huge effort, and few alive today will live to see it (short of large-scale engineering), but it is interesting to ponder the minute change this represents in the air -- a shift of just 5 one-thousandths of one percent (.005 percent) of the atmosphere! That is one of the fascinating things in climate science, how such a minute change in our atmosphere could potentially have such an impact on the energy balance of our whole planet.

Keep this in mind if you are trying to contemplate how big a deal it is that some 350,000 people came out into the streets of Manhattan, the capital of capitalism, the cultural heart of the nation where manufactured denial has most stymied action. That's because this happens to be exactly the same proportion of the 7 billion members of humanity, 5 one-thousandths of one percent, as that 50ppm is a shift in the composition of the air. Further, some have estimated the real number of marchers as 400,000, and if the global estimates swell equally, then globally about the same proportion were marching as the CO2 growth since industrialization is a shift in atmospheric composition. In a way, all those marching were just a trace, and as soon as we dissipated into streets and subways afterwards, quickly outnumbered by people going about their everyday lives, that seemed obvious, but in another way, how monumental the right little trace can become!

And speaking of powerful little traces, methane is even far less concentrated in the air than CO2, about 220 times less so, but there was really some methane floating around the Manhattan air yesterday! No, I don't mean all those leaky pipes in the city that have led local tests to sometimes register incredibly high ambient readings of the greenhouse gas. I mean that among the marchers anti-fracking signs often seemed to outnumber all other "sub-theme" signs. This is a fascinating phenomenon, as some of us have felt that, since we all ultimately must live in the here and now, and since one cannot impact the climate we have here and now very effectively through CO2 mitigation, yet one can only gain practical political traction by dealing with that here and now, so one of the best ways to gauge seriousness in getting movement going on climate would be to watch for meaningful action on methane. In a sense, if you want people to start climbing up a very steep ladder, you need to give them a nice low first step, and that first climate step would be methane. As Robert Watson, the previous Chair of the United Nation's Intergovernmental Panel on Climate Change put it succinctly, rapidly cutting methane, "would demonstrate to the world that we can do something to quickly slow climate change. We need to get moving to cool the planet's temperature. Methane is the most effective place for us to start."

The Manhattan climate march also provided a fitting example of how getting the big slow march of change rolling can be frustrating: for those in the back it took two hours to start any movement at all, and then another two hours to reach Columbus Circle, its ostensible starting point. Similarly inevitable drags on climate mitigation are making rapid methane action all the more important. And uncertainties in near-term climate change, with a rising potential for high-impact lower-probability events to cause abrupt heating (like non-human methane emissions in the arctic taking off more quickly than models predict), means that ignoring the near-term climate for too long could ultimately prove fatal to all our best intentions. So it's fascinating to see an interest in methane growing from the grass roots, even if it is still largely (and erroneously) confined to the fracking issue at this point. Let's hope that the interest in this merest little trace gas of our air -- since industrialization it has risen by about 1.1 ppm, a shift of about 1.1 ten-thousandth of 1 percent of the atmosphere! -- sparks soon. The group 1250 was initially intended to provide a kind of autonomous offshoot to McKibben's 350, in order to help generate that spark, but McKibben himself soon said that he "had his hands full with CO2" and did not at the time send along to his followers the group's initial petition drive, which then quickly languished. But if methane interest does reach that critical concentration, and that spark is provided, you know what happens next: that's when climate action goes boom.

Above text was earlier posted by Nathan Currier at the HuffingtonPost 

Below follow further photos by Cindy Snowgrass of the People's Climate March.


Thursday, September 18, 2014

Warm water flowing into Arctic Ocean

by Harold Hensel

For the first time in thousands of years, warm water is flowing into the Arctic Ocean. Warm water from the deep ocean is showing up on surface images. There is no way to put this into the context of 'normal.' Historic temperatures have kept the Arctic frozen on an even keel for thousands of years. Even if there was a 'natural cycle' it has been completely overridden by the astonishing amount of pollution that is going into the atmosphere.


Over 90 percent of Earth's energy imbalance has been going into the oceans, almost unnoticed by people keeping track of the temperatures in the atmosphere. The warmer ocean water is going through the Bering Strait and into the Chukchi Sea, Barents Sea, East Siberian Sea and worst of all, the Laptev Sea.

The Gakkel Ridge crosses the Arctic Ocean from Greenland to the Laptev Sea, see earlier post
There are methane hydrate concentrations in all of these areas up to 1,500 feet deep for miles and miles. There are fractures here that give mantel methane a route to the surface that have been safely sealed by ice. The hydrates and seals are thawing.

In 2013, huge amounts of methane erupted over the Gakkel Ridge and
the Laptev Sea
in October, with levels as high as 2662 ppb on November 9.
In 2014, levels over 2400 ppb were recorded on September 14, 15 and 16.

On the Greenland side, warm water is flowing into the Arctic from the Labrador, Greenland and Norway seas. The international SWERUSs-C3 expedition on the icebreaker Oden is recording 'mega flares' of methane. There are many factors involved in warming the Arctic Ocean, but warm water flowing into it is one of the worst.

Harold Hensel
Cedar Rapids